
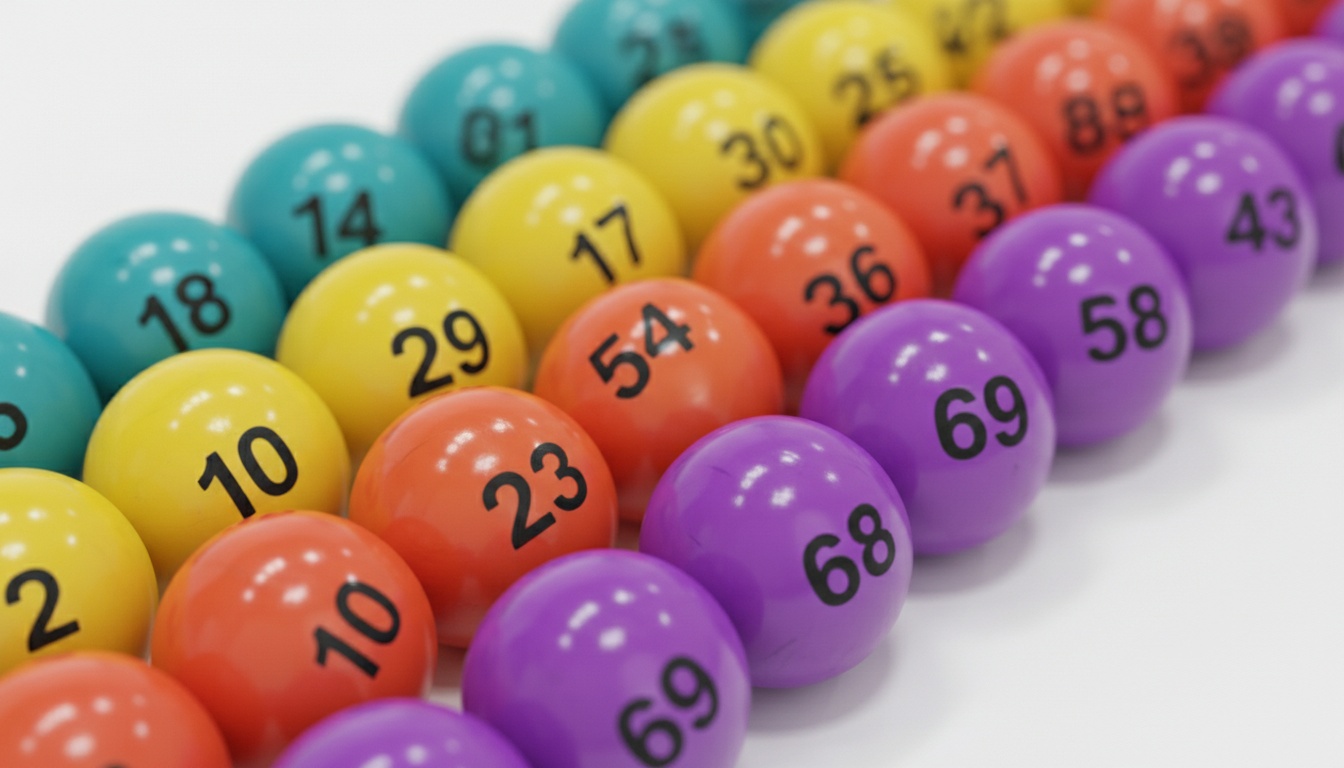
1. What 1,388 Draws Actually Show (And Why History Doesn't Predict the Next One)
Across the 1,388 draws held under the current matrix, from 7 October 2015 to 1 August 2026, white balls 21 and 61 lead on 123 appearances each. Number 64 follows on 121, then 28 on 119 and 36 on 117. At the other end, 13 has come up 75 times, and 26 and 49 have managed 81. Every count on this page is taken from our own draw record, not from a competitor's table.
That sounds structured. It isn't.
Why Historical Frequency Doesn't Predict Future Draws
A worked example of how easily this misleads: 61 is one of the ten balls that did not exist before October 2015, and it is tied for the most drawn ball in the whole pool. 64 is third. Meanwhile 13, drawn 75 times, has been available for every single one of those 1,388 draws. If frequency measured anything real, the newest balls could not be sitting at the top and an original ball could not be sitting at the bottom.
Each number's probability resets to 1-in-69 for white balls, or 1-in-26 for the red ball, every single time the machine runs. Drawing frequency tells you what happened. It tells you nothing about what happens next.
What Are the 6 Most Drawn Powerball Numbers?
Based on the 1,388 draws from 7 October 2015 to 1 August 2026:
Most frequently drawn white balls: 21 (123), 61 (123), 64 (121), 28 (119), 36 (117), 23 (116)
Most frequently drawn red Powerball: 4 (65), 14 (65), 21 (63)
For scale, a perfectly fair machine would give each white ball about 100.6 appearances over 1,388 draws, and each red ball about 53.4. The leaders are ahead by roughly what chance alone delivers.
Those counts describe history. They carry no weight about the next draw. Every draw is independent, and past frequency carries zero predictive weight.
How the 2015 Rule Change Scrambled the Frequency Data
On 7 October 2015, Powerball expanded the white ball pool from 1-59 to 1-69 and narrowed the red Powerball pool from 1-35 to 1-26. Any frequency table mixing pre-2015 and post-2015 draws without flagging this is comparing two different games.
That is why every figure here starts at the matrix change rather than at the beginning of the game. All 69 white balls have then had exactly the same 1,388 chances, so no ball is handicapped by arriving late and none of the counts need an asterisk. A table that counts from 1992 instead will show 60 through 69 as ice cold, purely because they did not exist for most of the period.
If a competitor's "hot numbers" article lists 63 as ice cold without mentioning the matrix change, that article is misleading you: inside the current matrix, 63 has been drawn 115 times against an expectation of 100.6, which puts it above average. Frequency rankings look completely different on each side of that date, which is itself evidence that the "patterns" people see are artifacts of sample selection, not signals in the draw process.
Odd/Even and Low/Mid/High Distribution
Across those 1,388 draws, the odd/even split in the five white balls broke down like this:
| Split | Share of draws |
|---|---|
| 3 odd, 2 even | 32.3% (448 draws) |
| 2 odd, 3 even | 30.8% (427 draws) |
| 4 odd, 1 even | 16.8% (233 draws) |
| 1 odd, 4 even | 14.6% (203 draws) |
| All odd | 2.9% (40 draws) |
| All even | 2.7% (37 draws) |
This is exactly what a uniform random process produces. With 35 odd and 34 even numbers in a 69-ball pool, the probabilities favor mixed draws by pure combinatorics. The combinations that look "balanced" dominate simply because there are more of them.
The low/mid/high breakdown, splitting 1-69 into thirds of roughly 1-23, 24-46, and 47-69, produced:
- Two low, one mid, two high: 15.1% of draws (209)
- One low, two mid, two high: 12.2% of draws (169)
- Two low, two mid, one high: 11.3% of draws (157)
- One low, three mid, one high: 9.6% of draws (133)
The average sum of the five white balls was 176.8, with half of all draws producing a sum above 177.5. Sums ran from 52 at the lowest to 299 at the highest, and 14.4% of draws landed below 100 or above 230.
We ran a chi-square goodness-of-fit test (a statistical method that compares observed data against what pure randomness would predict) across all 69 white balls. It returns a statistic of 80.48 on 68 degrees of freedom, for p = 0.14. That is not statistically significant at any conventional threshold: a perfectly fair machine produces a spread at least this uneven about one time in seven. In plain terms, the gap between 21 on 123 appearances and 13 on 75 is what randomness looks like, not what a pattern looks like.
None of this is a pattern in the predictive sense. It is the expected shape of random data.
2. Why You See Patterns in Lottery Data (Even When None Exist)
There's a documented cognitive phenomenon called apophenia: the tendency to perceive meaningful connections in unrelated data. It affects statistically literate people, not just casual players, and it almost certainly evolved as a survival trait. Better to wrongly see a predator in the shadows than miss a real one.
I've seen people cite a stretch where ball 39 appeared in 4 of 11 consecutive draws as proof of a sustained run. It wasn't. It was a run that sits well within normal variance for a 1-in-69 probability event across hundreds of draws.
Confirmation Bias and the Gambler's Fallacy
The gambler's fallacy runs alongside this. A ball that hasn't appeared in 20 consecutive draws has exactly the same 1-in-69 probability it always had.
The machine doesn't know you've been waiting.
Confirmation bias seals the loop. Players who track patterns remember the draws where their system appeared to work and forget the far more frequent draws where it didn't. Over time, the hits feel like signal and the misses feel like noise, which is exactly backwards. Large datasets plus emotional investment plus financial stakes create near-ideal conditions for perceived patterns to feel convincing.
If you want to verify the frequency data yourself, check your numbers against the latest draws.
Knowing this about your own cognition doesn't make the feeling go away. It just gives you a way to check it.
3. Can AI Predict Powerball Numbers? (Why Every Prediction Tool Fails)
No. Full stop.
AI prediction requires patterns in historical data that carry forward to future data. Certified random draws produce no such patterns. Feeding years of Powerball results into a machine learning model produces output that is mathematically equivalent to random guessing, because the input data contains no forward-looking signal for any model to learn.
Any tool claiming to predict winning number combinations is selling something. Hot number lists are a product, not a methodology.
4. How Powerball's Draw Process Prevents Patterns
Powerball draws use physical ball machines operated under Multi-State Lottery Association oversight, with certified backup systems available. According to publicly available MUSL documentation, the draw process involves multiple verification layers, and independent witnesses are present at each draw. The certification chain includes state lottery commissions and draw witnesses from outside the lottery organization itself.
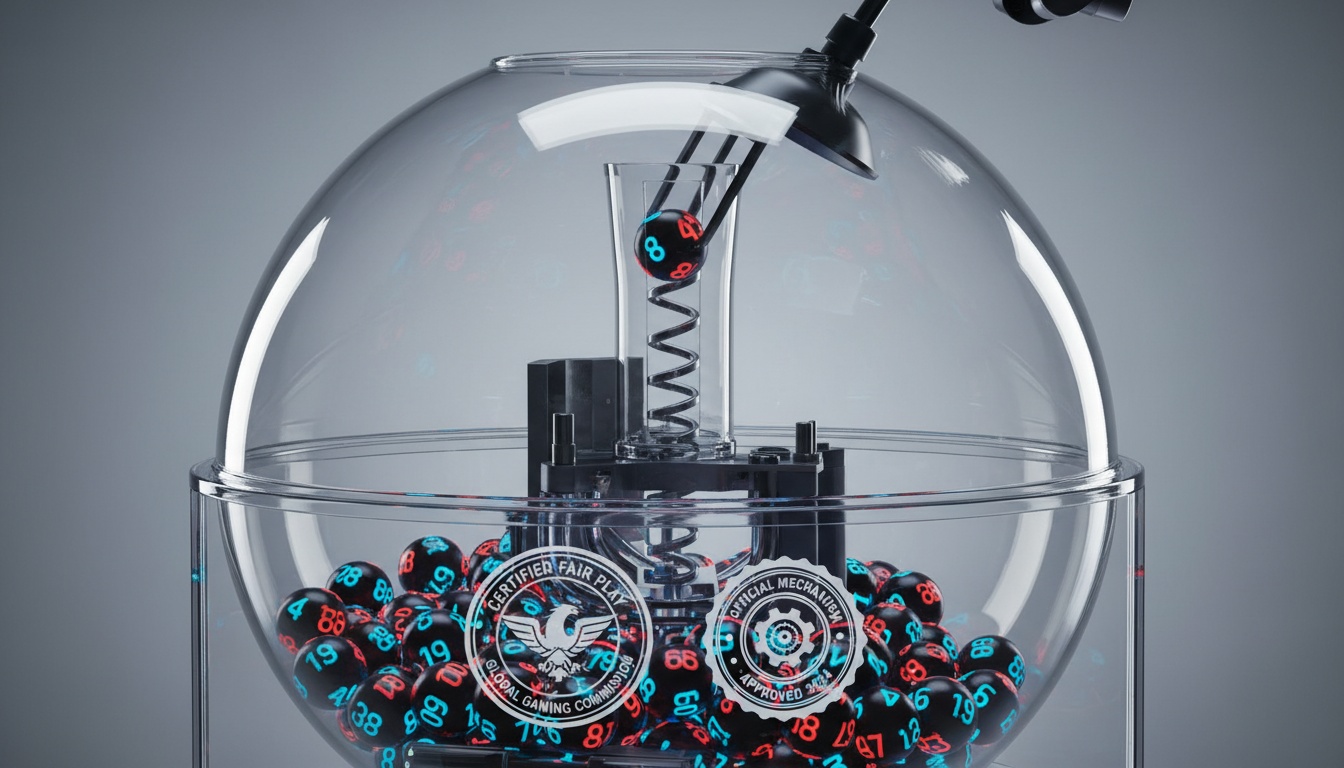
The conspiracy angle comes up often enough to address directly. Rigging Powerball draws at scale would require coordinating across dozens of state lottery commissions, multiple auditing parties, and draw witnesses, all of whom would need to stay silent across thousands of draws. The practical coordination required makes fraud implausible on logistical grounds, not just legal ones.
5. Quick Pick vs. Hand-Picked Numbers: What 1,388 Draws Prove About Selection Method
Given that the draw process is certified random, does the method of selecting your numbers, Quick Pick or manual, affect your odds?
Roughly 70-80% of all lottery jackpot winners used Quick Pick, and approximately 70-80% of all tickets sold are Quick Picks, a figure consistent across multiple years of official lottery commission reporting. The win rate is proportional to ticket volume, not superior to it. I've seen this statistic misused more than almost any other in lottery coverage: Quick Pick is not a superior strategy. It is a neutral one.
Pattern-based selection doesn't hurt your odds. It doesn't help them either.
The odds on any single combination of five white balls plus one red ball are 1 in 292,201,338, regardless of how you chose those numbers.
Has Anyone Won Powerball With a Quick Pick?
Yes, most jackpot winners used Quick Pick, and official Powerball records confirm ticket type in many cases. Winners who chose their own numbers have also taken jackpots. The method of selection has never been shown to affect the probability of winning, because the probability is determined by the draw, not the ticket.
Did Anyone Actually Win Using a Number Pattern?
Stefan Mandel won multiple lotteries by buying enough tickets to cover most possible combinations. Powerball's scale makes this impossible: 292 million combinations at $2 per ticket would cost $584 million, exceeding most jackpots before taxes.
The most cited case in lottery strategy discussions is Mandel, a Romanian-Australian mathematician who exploited a structural feature in smaller lottery prize pools where the jackpot exceeded the cost of buying every combination. Powerball's design closes that loophole entirely. At 292 million combinations and a minimum ticket cost of $2, covering the full number pool would cost roughly $584 million. That exceeds most jackpots before taxes, let alone after.
No verified Powerball jackpot winner has publicly credited a frequency-based pattern system.
That absence is meaningful. Hundreds of jackpots have been awarded since the current matrix launched. If a reliable pattern-based approach existed, the statistical signature would appear in winner data. It doesn't.
The One Area Where Number Selection Actually Matters
Players who choose "meaningful" numbers, birthdays, anniversaries, tidy sequences, cluster their picks between 1 and 31 (the calendar range). Published hot-number lists crowd whatever numbers they publish. If those numbers hit, more people share the prize.
Avoiding heavily-played number combinations does not improve your probability of winning. It does improve your expected payout if you win, because you are less likely to split the jackpot. Some players use number generators to explore combinations outside the 1-31 cluster for this reason.
6. What Are the Most Likely Powerball Numbers to Win?
No number or combination is statistically more likely to appear in future draws. Each combination of five white balls plus one red Powerball carries identical odds: 1 in 292,201,338.
Why Historical Frequency Doesn't Predict Future Draws
"Most likely" is a misframing. Historical drawing frequency is descriptive. It tells you what happened. It carries no predictive weight about what will happen next, because each draw is independent.
Frequently drawn and infrequently drawn numbers are artifacts of a finite sample. Over 1,388 draws, the gap between the most and least drawn ball looks significant. A chi-square goodness-of-fit test against a uniform distribution returns p = 0.14, which is not statistically significant. The spread you see is exactly the spread a random process produces.
If you want to run your own frequency analysis, the MUSL publishes the full draw history at the official Powerball draw archive. Paste it into any spreadsheet and run a chi-square test against a uniform distribution. In Excel, the formula is =CHISQ.TEST(). The result will confirm what this article shows. If you have a ticket to verify, verify your ticket against official results.
Use any numbers you like. No selection method changes your lottery odds. Results on this site are unofficial: always verify with the official operator or your retailer before acting on any figure.
If you or someone you know has a gambling problem, the National Problem Gambling Helpline is available 24/7 at 1-800-522-4700.
7. Key Takeaways
- No exploitable pattern exists in Powerball draws.
- Every draw is independent, past frequency carries zero predictive weight.
- The 2015 expansion from 59 to 69 white balls reset frequency rankings entirely.
- Frequency tables mixing pre- and post-2015 draws without flagging this are misleading.
- Across 1,388 draws, white balls 21 and 61 led on 123 appearances each, against an expectation of 100.6. Red balls 4 and 14 led on 65.
- The chi-square distribution of those counts is consistent with randomness, not with a pattern.
- Odd/even and low/mid/high distributions match what uniform random selection predicts.
- The "most common" patterns cover roughly 20-24% of draws each, as combinatorics would suggest.
- Quick Pick wins at the same rate as manual selection because it accounts for the same share of tickets sold.
- The only selection decision with a real mathematical consequence is avoiding heavily clustered combinations, specifically 1-31 and published hot lists, to reduce jackpot-splitting probability if you win.
- AI cannot predict Powerball numbers. Certified random draws contain no forward-looking signal for any model to learn.
- Stefan Mandel's approach required buying most possible combinations in a small lottery. Powerball's scale makes that economically impossible.
The math is clear: no pattern exists. If you have a ticket to settle, check it against the latest draw.